Facilities
fMRI Data Analysis
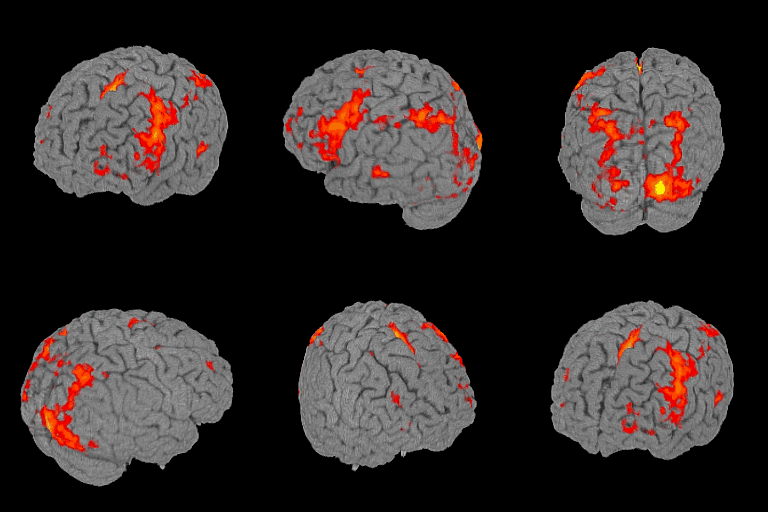
The data collected at the scanning sessions are brought to the CCBI via FTP and are placed on the Linux cluster (see computing facilities). Data are then analyzed in several stages using SPM, user-supported toolboxes, and custom software. The software includes tools for individual subject processing as well as a collection of options for analyzing groups of subjects. In the first stage of analysis, the signal processing procedures applied in SPM aim at removing several kinds of variation (over the course of the testing session) in the MR signal that are unrelated to the experimental manipulations. Images are corrected for both slice timing acquisition and head motion. The images are then normalized to the Montreal Neurological Institute (MNI) template, resampled to 2x2x2 mm voxels, and typically smoothed with a Gaussian kernel to decrease spatial noise. Then, the brain activity is compared between experimental conditions, and, in some cases, population groups. SPM uses a temporal convolution of the paradigm with a model of the hemodynamic response function of the fMRI signal in a general linear model that estimates parameters of the experimental and confounding effects of the experiment. Group analyses are performed using a random-effects model. Statistical maps are adjusted for multiple comparisons using Gaussian random field theory and are superimposed on normalized T1-weighted images for inspection. These data are summarized at the individual subject level with measures such as the mean percentage change in signal intensity or volume of activation in regions of interest (ROIs), defined either a priori, on an anatomical basis, or post hoc, on a functional basis. These summary data can then be analyzed further for group or condition effects.
 In some experiments, we also examine the functional connectivity for each participant, which is the correlation between the activation time series data of two brain areas. We first define a set of functional ROIs. For each ROI we obtain a single averaged time course. Functional connectivity between an ROI pair is estimated as a correlation coefficient between the averaged time courses of the corresponding ROIs. Functional connectivity is known to be modulated by a number of variables, such as amount of learning, task complexity, and brain pathology.
